Some days it is hard to focus on work – any day where I have to look at large-scale copy-edits is one of them. So I decided to procrastinate by calculating my Erdös-Chomsky-Bacon number (modified), which is any publication links across co-authors to Paul Erdös and Noam Chomsky, as well as any filmed acting across actors to Kevin Bacon. That last part is a cheat because a Bacon number is supposed to be movie-only connections, but I’m OK with that because I was paid to do the acting.
My Erdös-Chomsky-Bacon number is 13:
Erdös Number = 4
Donald Derrick -> Daniel Archambault
Derrick, Donald and Archambault, Daniel Treeform: Explaining and exploring grammar through syntax trees. Literary and Linguistic Computing, (2010). 25(1):53–66.
Daniel Archambault -> David G. Kirkpatrick
Archambault, Daniel; Evans, Willam; Kirkpatrick, David Computing the set of all the distant horizons of a terrain. Internat. J. Comput. Geom. Appl. 15 (2005), no. 6, 547–563.
David G. Kirkpatrick -> Pavol Hell
Kirkpatrick, D. G.; Hell, P. On the complexity of general graph factor problems. SIAM J. Comput. 12 (1983), no. 3, 601–609.
Pavol Hell -> Paul Erdős Erdös, P.; Hell, P.; Winkler, P. Bandwidth versus bandsize. Graph theory in memory of G. A. Dirac (Sandbjerg, 1985), 117–129, Ann. Discrete Math., 41, North-Holland, Amsterdam, 1989.
Chomsky number = 5
Donald Derrick -> Michael I. Proctor Examining speech production using masked priming. Chris Davis, Jason A. Shaw, Michael I. Proctor, Donald Derrick, Stacey Sherwood, Jeesun Kim Proceedings of the 18th International Congress of Phonetic Sciences, 2015
Michael I. Proctor -> Louis Goldstein Analysis of speech production real-time MRI. Vikram Ramanarayanan, Sam Tilsen, Michael I. Proctor, Johannes Töger, Louis Goldstein, Krishna S. Nayak, Shrikanth Narayanan Computer Speech & Language, 2018
Lousi Goldstein -> Srikantan S. Nagarajan A New Model of Speech Motor Control Based on Task Dynamics and State Feedback. Vikram Ramanarayanan, Benjamin Parrell, Louis Goldstein, Srikantan S. Nagarajan, John F. Houde Proceedings of the Interspeech 2016, 2016
Srikantan S. Nagarajan -> David Poeppel Asymptotic SNR of scalar and vector minimum-variance beamformers for neuromagnetic source reconstruction. (DOI) Kensuke Sekihara, Srikantan S. Nagarajan, David Poeppel, Alec Marantz IEEE Trans. Biomed. Engineering, 2004
David Poeppel -> Noam Chomsky Governing Board Symposium The Biology of Language in the 21st Century. (DOI) Noam Chomsky, David Poeppel, Patricia Churchland, Elissa L. Newport Proceedings of the 33th Annual Meeting of the Cognitive Science Society, 2011
Bacon number = 4
Donald Derrick -> Earl Quewezance “Frontrunners” by European News at the “Play the Game” conference (2005)
Earl Quewezance -> Rob Morrow “The Mommy’s Curse”, episode 6, Northern Exposure (1995)
Rob Morrow -> Embeth Davdtz Emperor’s Club (2002)
Embeth Davidtz -> Kevin Bacon Murder in the First (1995)
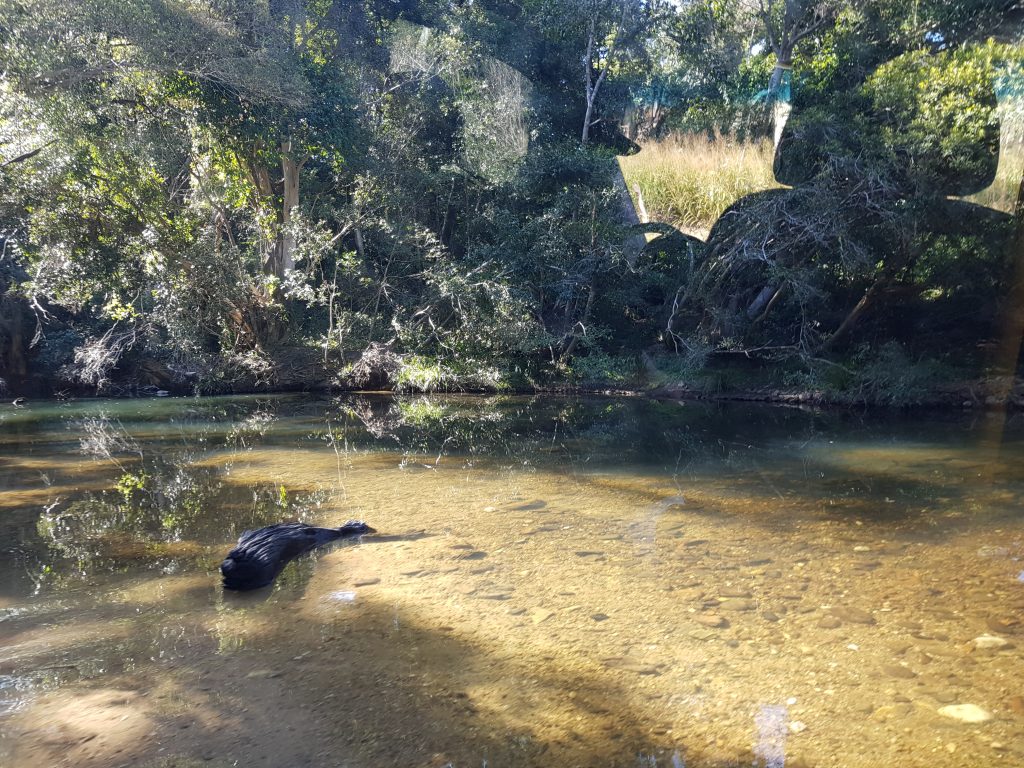
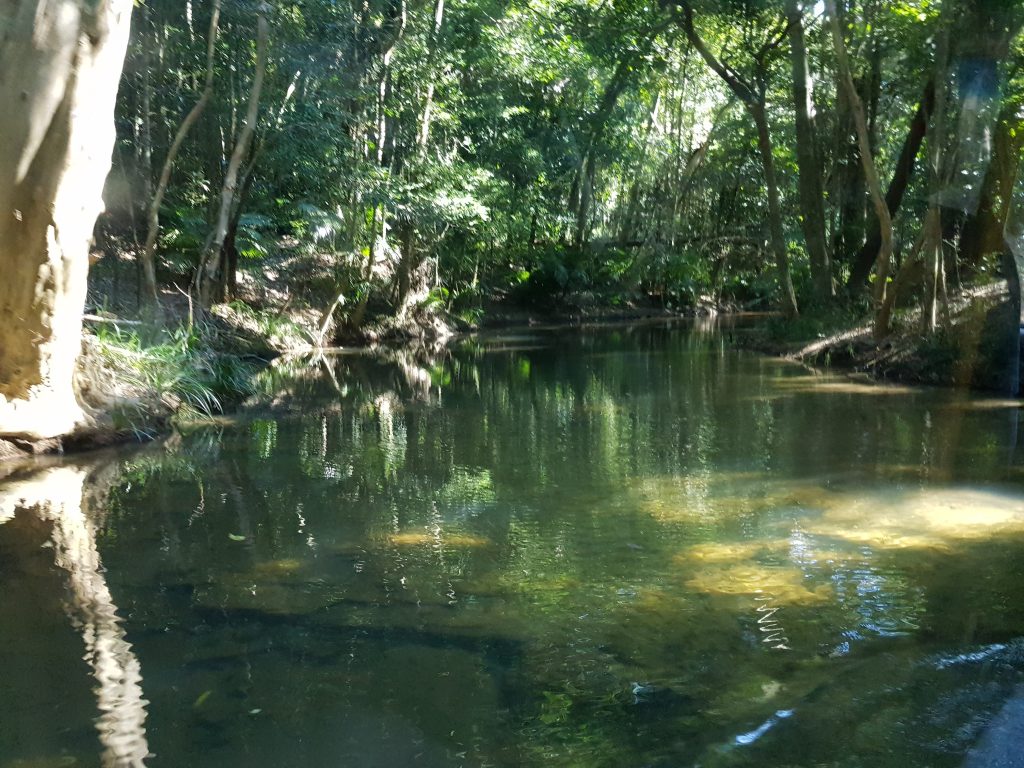
Before I return to my normal posts on Linguistics and Speech research, I have one more thought on my post-ICPhS trip to Cairns. After the dive, I went to the edge of the rain-forest on a half-day 4×4 tour. It was more sitting and less walking than I would normally go for, but the views were pleasant.
The trip showed us the amazing strangler fig, which is essentially an immortal tree that has serious ill-intent with the trees it grows next to. If you are dumb enough to grow near one of these monsters, within 100 years you are dead, dead, dead!
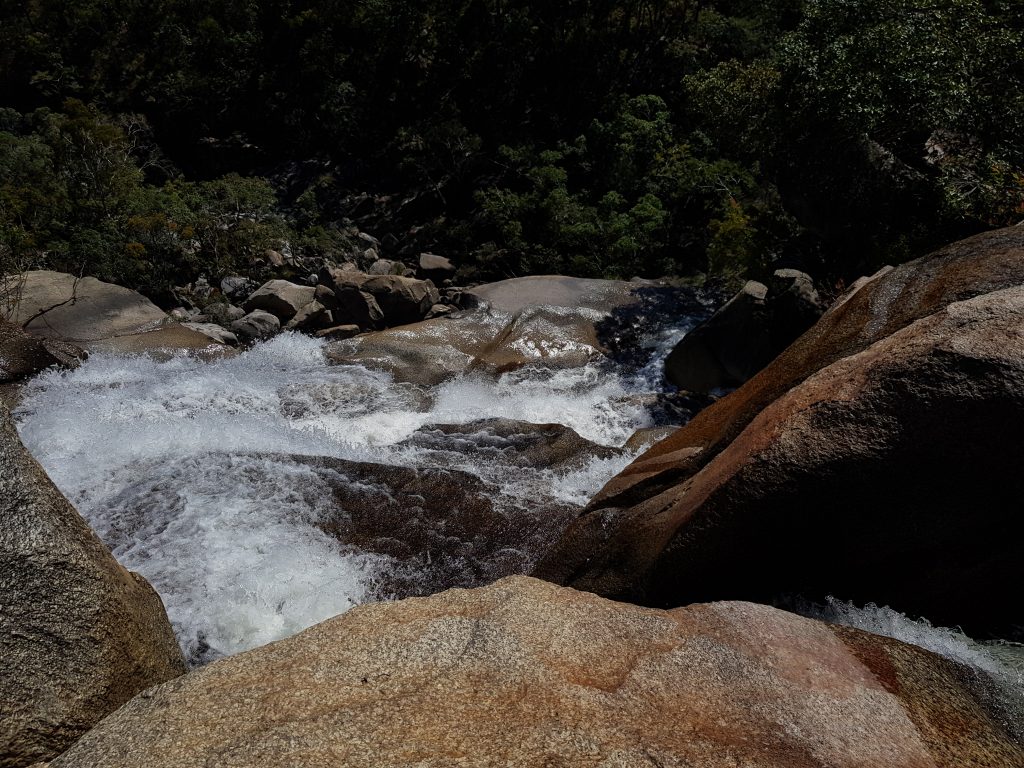
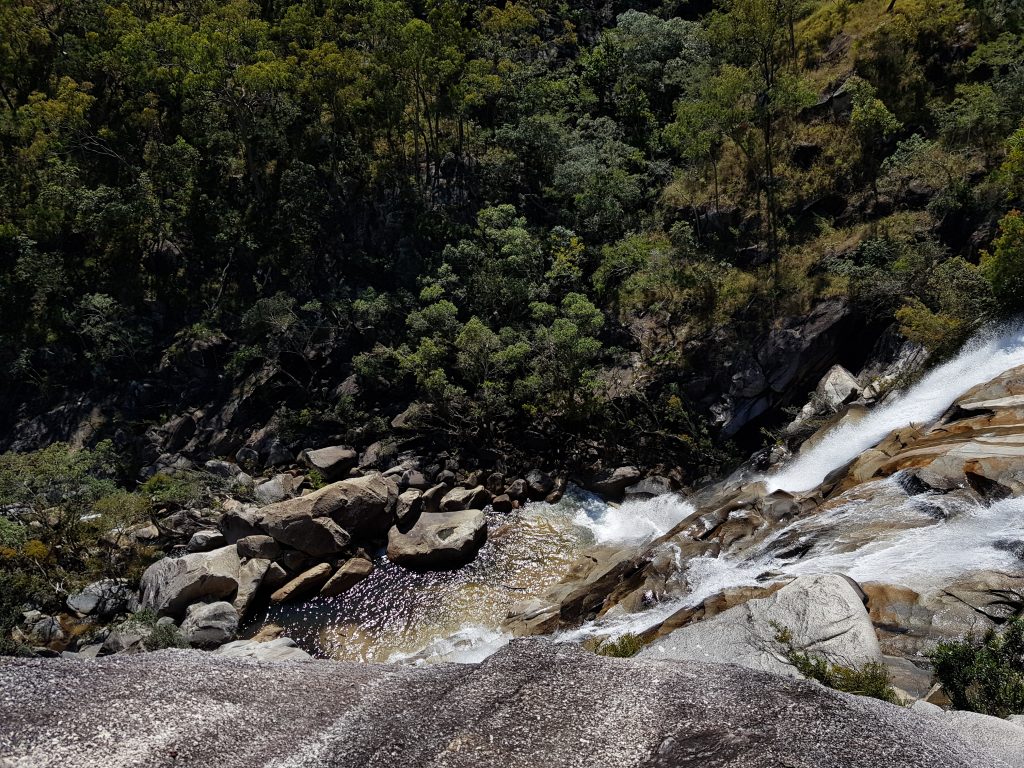
And the waterfall we went to at the end of the trip was stunning.
But there was one long part where the guide had us standing still for 30 minutes listening to a discussion of local wildlife mixed with the usual guilt-trip about ecological destruction. In one sense, that is fair enough. Humans have an enormous impact on this planet, and plenty of it is negative. But in another sense, I just wanted to crawl out of my skin. Not because I felt guilty for what I’ve done, but because I have absolutely no idea how this approach can help make the world a better place.
I can appreciate that the Australian government is not letting Cairns reuse brown-space for a new boat launch but instead is forcing them to tear down a valuable mangrove. But I can’t do anything about it. I am not Australian, I don’t vote in Australia, and I can’t force the Australian government to save the mangroves. Even though I would LOVE to because I want the Great Barrier Reef to keep growing spectacular fish! There was also a lot about how tourists should support family businesses over large-scale tourism businesses.
But it went to long. We had old people on this trip, and one of them had lost circulation in her legs listening to the over-long presentation. She fell trying to walk back to the vehicle after the talk. She wasn’t badly hurt, but that is the kind of thing that can break a hip, greatly shortening the life of the elderly person in question!
The guide also complained about the large influx of population into Cairns, who then demand a quieter place that involved cutting trees bats live in, and otherwise reducing the wonders of nature in the area to make the place more like the big cities they came from. Fair enough, but I heard no solutions. And I thought “stronger insulation and noise-control laws, or education about good construction standards, would end that nonsense.” I though “there are really effective solutions that we can implement ourselves, so tell everyone about them!” And as a result, I was frustrated because of the missed opportunity.
I compare this approach to that of Reef Encounters. They brought us to a beautiful place full of natural wonders. When we complimented them on their good job, they made it clear it was *nature* that did the good job, and we all benefit from what nature does. When we went diving, the guides always picked up any trash they saw on the ocean floor, and taught us to do the same. When the great food was served and the good times were had, they thanked us for supporting a local family business instead of one of the large-scale tourism businesses.
And there it is. They let nature speak for itself. They embodied solutions. They did a great job and thanked us for supporting local businesses *after* they did that great job. People who experience such things will appreciate nature, know how and engage in good ecological behaviour, and continue to make better choices for local communities.
So here is to all those who embody good ecological behaviour, cleaning up after themselves and others. Here’s to the people who build improved technologies that waste less and are more efficient. Here’s to those who keep track of nature – and trade – exposing it to the light where it can be made as good as possible, a little better every day. And yes, here’s to those who vote to preserve mangroves and re-use brown space for boat-docks.
After the International Congress of the Phonetic Sciences in Melbourne, my friend Phil Howson and I went diving in the Great Barrier Reef off the coast of Cairns. The trip was truly amazing. During this time, I did 10 dives, 5 of them to train for advanced open-water conditions – diving to 30 meters (100 ft).
The conditions were absolutely amazing, as you can see from the boat shots from the professional photographer (these are all Tilly’s shots, I saw similar things, but I do not have either the gear nor the eye to take shots like this!)
My friend Phil and I had a lot of fun, above and below water.
And the reef was amazing.
And that was just the coral. I most definitely found Nemo. Often. More often than Tilly photographed them.
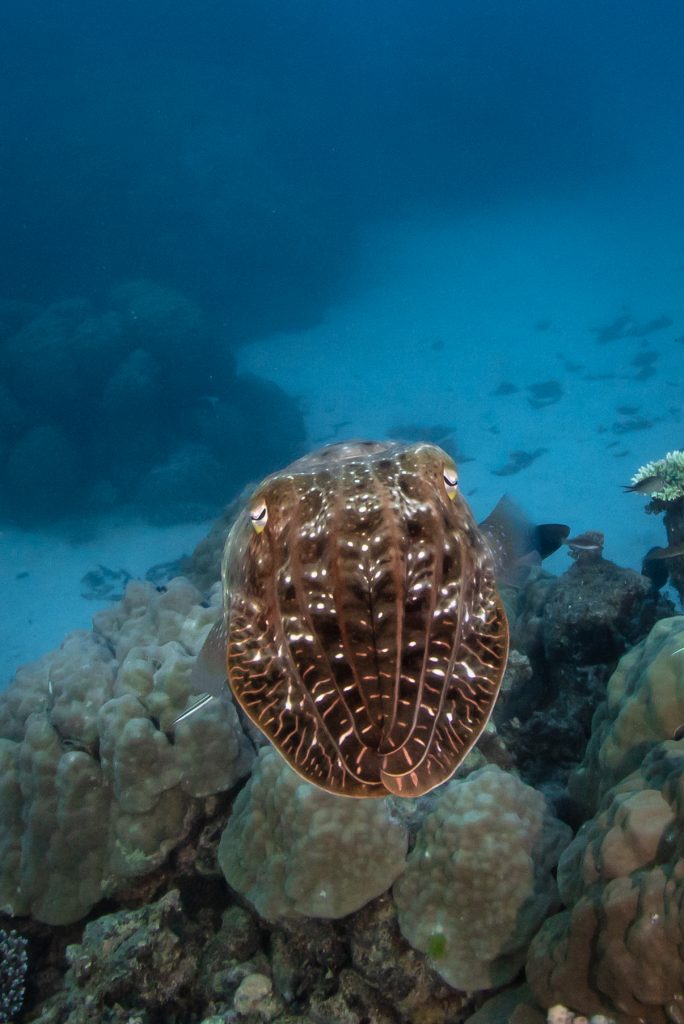
And I might have encountered a couple of elder things. Tilly even got a shot with the face-hugger look. For me, the cuttlefish was always closed like photo 1 and 2.
I saw lots of little fish like these.
And crazy schools of fish – some even more impressive than these.
I cannot count the number of times I saw scenes like this, but with much wider views and more variety of fish.
I saw rays quite often.
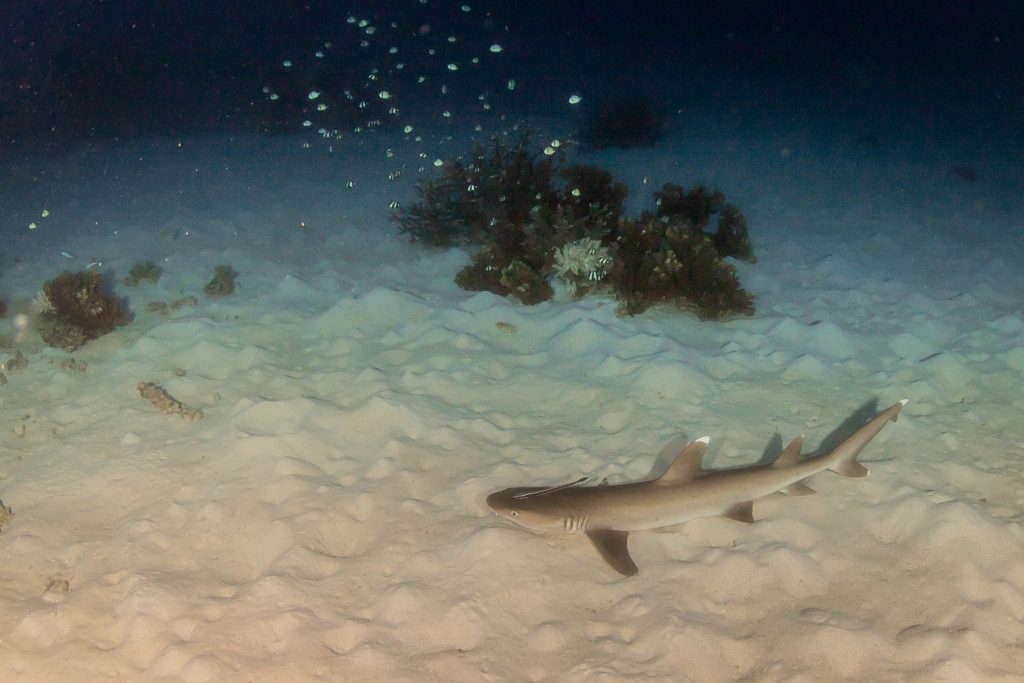
And I played light with heaps of these little doggies of the sea. If you ever told me I’d ever play light with a shark, I’d have called you barking mad! I clearly have no actual sense! (Sharks tend to like the light as they use it to catch fish, but other fish such as fusiliers are super-keen on using your light and they will surround you like crazy!)
I swam with these turtles, but I did NOT see the one eating the jellyfish. That my buddy saw, and of course Tilly taking the photos.
And I even have some proof of swimming with the turtles.
I also enjoyed the slower creatures. Giant clams!
Unfortunately, I did not see the moray pictured here. Tilly got great shots though!
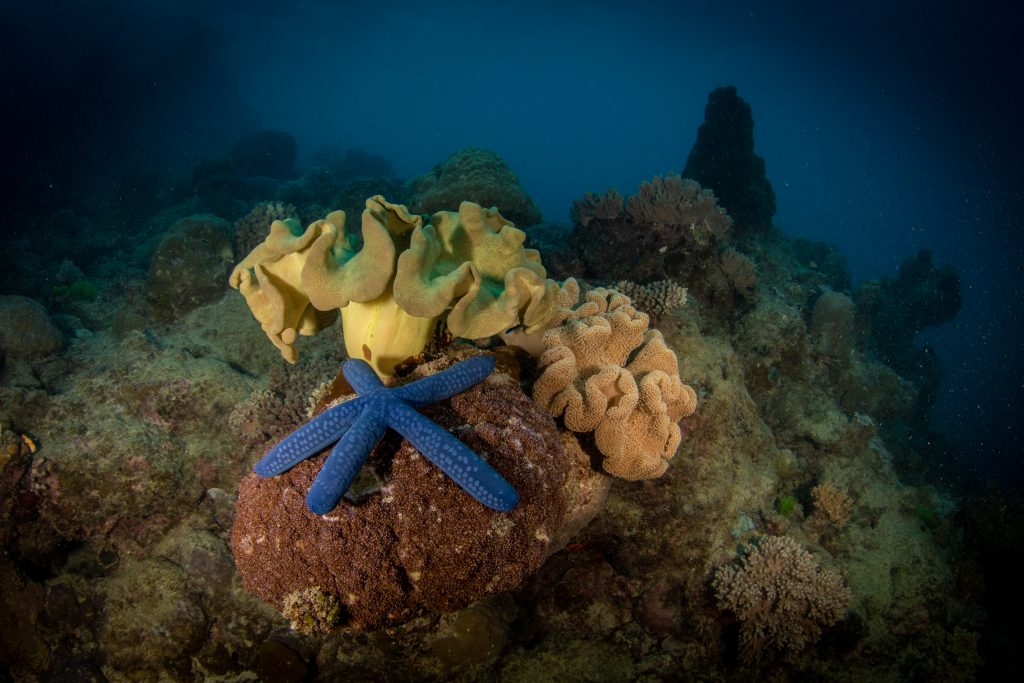
And I never saw a starfish on the trip either, though we do have shots from Tilly.
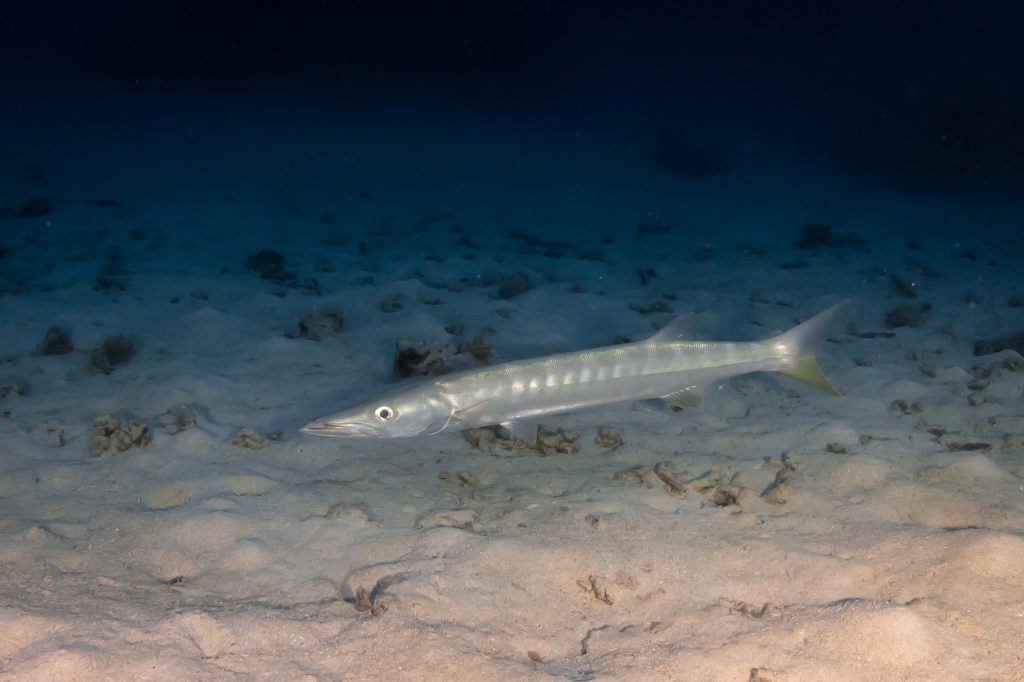
But, I did see these guys:
This trip was truly amazing. It really does look like this under the ocean at the Great Barrier Reef, and even more amazing than this. My first night-dive was a kaleidoscopic fever-dream better than my wildest imaginings. I cannot recommend diving enough.
EDIT: I now have a photo of my deep dive to 30M during dive training. The depths are an eerie place, where cracked eggs stay intact, and red tomatoes look green. They are worth a quick and carefully planned visit. Running out of air is EASY. On my training my instructors deliberately shared air with me, and I deliberately used the back-up bottle at 5M depth, as skill practice.
Here is a basic demonstration of how randomness works, but because I am writing this for linguists rather than statisticians, I’m modifying the standard coin-toss example for speech. Imagine you have a language with words that all start with either “t” or “d”. The word means the same thing regardless, so this is a “phonetic” rather than “phonemic” difference. Imagine also that each speaker uses “t” or “d” randomly about 50% of the time. Then record four speakers saying 20 of these words 10 times each.
Now ask the question: Will some words have more “t” productions than others?
The answer is ALWAYS yes, even when different speakers produce “t” and “d” sounds as completely random choices. Let me show you:
As with most of these examples I provide, I begin with code for libraries, colors, and functions.
randomDistribution <-function(maxCols,maxRep,replaceNumber,cat1,cat2)
  {
    distro = tibble(x=c(1:maxCols),y=list(rep(cat1, maxRep)))
    for (i in sample(1:maxCols, replaceNumber, replace=TRUE))
    {
      distro$y[[i]] <- tail(append(distro$y[[i]],cat2), maxRep)
    }
    distroTibble = tibble(x = c(1:(maxCols * maxRep)), n = 1, y = "")
    for (i in c(1:maxCols))
    {
      for (j in c(1:maxRep))
      {
        distroTibble$x[((i-1)maxRep)+j] = i
        distroTibble$n[((i-1)maxRep)+j] = j
        distroTibble$y[((i-1)*maxRep)+j] = distro$y[[i]][j]
      }
    }
    return(distroTibble)
  }
And now for the data itself. I build four tables with 20 words (x values) and 10 recordings (n values) each, with the recordings labelled in the “y” value. I start by labeling all these “t”, and then randomly select half of the production and call them “d” instead of “t”. I then compute the percentage of each variant by word (x)
I also combine the four speakers, and do the same for all of them.
Now I plot a distribution graph for all of them. Note that some words are mostly one type of production (“d”), and others are mostly the other production (“t”). This inevitably occurs by random chance. And it differs by participant.
However, even when you pool all the participant data, you see the same result. This distribution is a part of the nature of how randomization works, and needs no other explanation other than this aspect of randomization is a part of the nature of reality.
And you can see that the combined data from all four speakers still shows some words that have almost no “d”, and some words have very few “t” values.
Because a purely random distribution will generate individual words with few or even none of a particular variant, even across speakers, you cannot use differences in the distributions by itself to identify any meaningful patterns.
And that is the “coin toss” tutorial for Linguists – also known as the central limit theorem. The main takeaway message is that you need minimal pairs, or at least minimal environments, to establish evidence that a distribution of two phonetic outputs could be phonemic.
Even then, the existence of a phonemic distinction doesn’t mean it predicts very many examples in speech.
One of the easiest and most appropriate methods for testing whether a data set contains multiple categories is k-means clustering. This technique can be supervised, in that you tell the computer how many clusters you think are in the original file. However, it is much wiser to test many k-means clusters using an unsupervised process. Here we show three of these. The The first one we will examine is the “elbow” method, runs several clusters, and produces a graph that visually lets you see what the ideal number of clusters is. You identify it by seeing the “bend” in the elbow. Here’s some code for generating a very distinct binary cluster and running the elbow test.
The third shows a “gap” statistic, with the highest peak identified.
gap_stat <- clusGap(G[, 1:2], FUN = kmeans, nstart = 25, K.max = 10, B = 50) fviz_gap_stat(gap_stat)
As you can see, all three cluster identification techniques show that the ideal number of clusters is 2. Which makes sense because that is the number we initially generated.
Here I show you what the difference between the real cluster and the estimate cluster looks like, beginning with the real cluster.
Notice that even with 2 standard deviations separating the groups, the elbow technique DOES diagnose that this is a binary system, but barely. The silhouette and gap techniques also point to a binary.
However, K-means clustering can still uncover the binary.
References:
Weitzman, M. S. (1970). Measures of overlap of income distributions of white and Negro families in the United States. Washington: U.S. Bureau of the Census.
Having previously demonstrated what two binary groupings look like when they are separated by six standard deviations, here I demonstrate what they look like when separated by 4 standard deviations. Such a binary has an overlapping coefficient of 4.55%, as seen from the code below, which computes from integration based on Weitzman’s overlapping distribution.
## 0.04550026 with absolute error < 3.8e-05
## [1] "4.55%"
This is what such data looks like graphed in a density curve.
The overlap range is now much larger, as can be seen in the scatterplot below.
Now let’s look at an overlap range of 2 standard deviations.
## 0.3173105 with absolute error < 4.7e-05
## [1] "31.73%"
The density plot now overlaps a lot.
And this is what the scatterplot looks like.
Now look at the scatterplot without color differences. At this point there is the barest of hints that there might be a binary in this system at all.
Let us compare that to the initial binary, separated by 6 standard deviations, now in grey.
With this data, the binary remains visible and obvious even when both samples are gray.
However, even if you cannot observe categories by directly looking, there are tools that can help identify N-nary categories in what looks to us like gradient data – the tools of unsupervised cluster analysis, which I will discuss in the next tutorial.
The RMarkdown file used to generate this post can be found here. Some of the code was modified from code on this site.
References:
Weitzman, M. S. (1970). Measures of overlap of income distributions of white and Negro families in the United States. Washington: U.S. Bureau of the Census.
This post provides a visual example of gradient behaviour within a univariate binary system.
Here I demonstrate what two binary groupings look like when each binary is separated on a non-dimensional scale of 1 standard deviation for each binary, with a separation of 6 standard deviations. Such a binary has an overlapping coefficient of 0.27%, as seen from the code below, which was computed from integration based on Weitzman’s overlapping distribution.
## [1] "0.27%"
But the overlapping range hides the fact that in a group of, say, 10,000 for each binary, the outlier overlap is often enormous, and sometimes individual tokens look like they belong firmly in the other binary choice – like the one blue dot in the gold cloud. (Note that the y-axis is added to make the display easier to understand, but provides none of the data used in this analysis.)
In short, in a binary systems, individual tokens that exist thoroughly within the other binary range will exist due to simple random variation, yet they do not present evidence of constant gradient overlap or against the existence of the binary. Such things occur as long as the two binaries are close enough in relation to the number of examples – close enough being determined by simple probability, even in a univariate system (one without outside influences.)
The RMarkdown file used to generate this post can be found here. Some of the code was modified from code on this site.
References:
Weitzman, M. S. (1970). Measures of overlap of income distributions of white and Negro families in the United States. Washington: U.S. Bureau of the Census.
I have always kept this site for professional work to date, but following a recent shout-out, today I’m going to introduce you to something totally different: A review of speculative fiction.
After an initial awkward meeting at Dalhousie Chemistry Week, Kristin Janz and I became friends as we attended University at Dalhousie, in Nova Scotia (the remote outcropping of rock on the Eastern Edge of Canada where we both grew up.)
I recently read a book in which she is a short-story author: Mythic Orbits Volume 2, and enjoyed it greatly.
Now, while all of the stories are worth reading, there were a couple that were themes I’ve seen often before. I’m not good at reviewing stories with themes I’ve seen often before, so I’m going to give short thoughts on the ones that are newer for me. For people like me, it is worth noting that the stories get more theme-original as you progress through the book, but that is a very vague generalization, so you are better off with my very short reviews of each story:
Donald S. Crankshaw’s “Her Majesty’s Guardian” was a simple, well-executed piece with a glorious conclusion. It reminded me of the way many of the smaller societies of Earth used to handle leader purification – brutal and effective!
Linda Burklin’s “Dragon Moon” is a visually stunning story with heartwarming family-protective elements.
Kristin Janz’s “The Workshop at the End of the World” evokes perfectly how I feel every time I consider walking into a “Toys’R’Us” – and then decide I just can’t face how bloody boring the store is. Let the reader understand.
Cindy Koepp’s “Seeking What’s Lost” is raw and brutal and deeply personally tragic. Keep a box of tissues nearby, and be prepared to use them liberally.
If you are a religiously active Christian like me, you would think you’ve read C.O. Bonham’s “Recalled from the Red Planet” a million times… But oddly enough, you haven’t, because no one is ever this wonderfully direct about this particular story.
William Bontrager’s “They stood still” was my favorite story. Years ago a friend showed me a draft of a novel she was working on with scenes of time standing still that were so good I’ve lived decades since waiting to ever read anything like it again. I will never forget how it felt to read time stop, the sheer wonder and utter terror of it. I felt the whole world around me go quiet. Time stood still for me. And Bontrager brought me to that quiet place for only the second time in my reading life. The rest of his story of post-traumatic-stress is just as good, and I would have bought this entire book for that story alone.
A.K. Meek’s “The Memory Dance” is easily the strangest and most original piece in this collection. In some ways, it reminded me of “Leaf by Niggle”, one of Tolkein’s greatest short stories. And following that comment, for the most part, if you want to read something this wonderfully out-there, you have to go pre-1940s sci-fi.
Keturah Lamb’s “Unerella” is a glorious take on Cinderella, and I wish there were many more such stories on Earth – a situation I’m very slowly trying to remedy myself. Kat Heckenbach’s “Mark the days” is the kind of story you wish movies like “Memento” or “Mulholland drive” could be – a tiny bit easier to follow, and infinitely less pretentious. Give the whole book a read, and you’ll be happy.